
This paper presents an introduction on the use of the Python language for astronomy and spectroscopy to perform rapid spectrum analysis of the gam Cas star.
In order to be able to use Python to display a star spectrum generated by ISIS 1, Demetra 2, VSpec 3, (…), it is necessary to know some basics of programming. I will not detail in this article the basics of software development in order to focus only on an astronomy oriented use of the language, staying on an introduction and presentation of the tools, from their official documentation. However, there are many resources that will allow you to start and integrate the basics of programming, in Python. Books, links and videos are listed at the end of this article as resources.
This article thus presents various libraries that allow to retrieve information on the object of study, to consult official catalogs, and to visualize spectroscopic data in order to make a simple analysis.
The sources of the code and the dataset used are available via the links at the end of the article.
In the program
Coordinates of gam Cas – Visual Profile – Viewing images – gamCas Spectrum – MultiSpectrum Display – Resources
To take over and execute the code as presented here, it is recommended to use a “Jupyter Notebook” 4. These digital notebooks thus allow you to benefit from an execution environment in several languages, including Python. Their strength lies in their ability to execute code and present text at the same time, known as markdown 5, all in a pleasant and light style. They are widely used in astronomy and data science.
There are a number of online platforms that offer the possibility of running them without installing all the necessary environment on your machine :
Colab
Platform based on Jupyter Notebook from Google. Free, requires only a Google account.
Cocalc
Allows you to create Notebooks without registering.
Binder
Allows you to run Notebooks available on Github or Gitlab. The code presented here is available for download at the end of this article. It is thus possible to run it in Binder by pasting this address.
However, for a current and advanced use it is preferable to install Python on your machine, with the Anaconda suite, for example, which allows to have Python and to instantiate Jupyter Notebooks. The software suite is available here : https://www.anaconda.com/products/individual
Profile of gamma Cassiopeiae
To get started, it may be interesting to look for information about our target, especially its position. One of the most widely used libraries dedicated to astronomy is Astropy. This library, beyond the basic use which is made here, includes many very advanced internal modules. It is an open source project with many regular contributions which started in 2011 and is widely used in the professional world.6, 7
If some libraries are not installed on your machine, or in your virtual environment (more info on virtual environments here), install at the beginning of your notebook, preceding the command with an exclamation mark or in a terminal, with pip as in the example below :
pip install astropy
Without further delay, let’s launch a Jupyter Notebook, and let’s go!
In addition, it is also possible to query the various catalogues with the Astroquery library, as in the example below with a query to SIMBAD8, whether it is an object in the sky or an entire region. The list of catalogue modules is available here : https://astroquery.readthedocs.io/en/latest/
In addition, adding the “sptype” field to the VOTable query also allows you to retrieve the spectral type of the star. The list of possible criteria is available here.
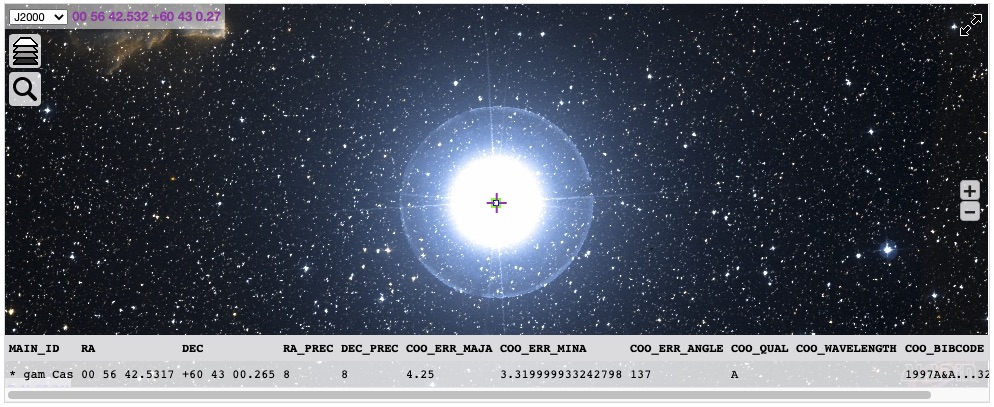
To add a slightly more visual side and visualize our target in different colours or spectral ranges, there is even an Aladdin Widget. Attention, this requires activating the widgetsnbextension of our notebook. The activation of this widget is detailed on the github at this address : https://github.com/cds-astro/ipyaladin
Here is the rendering and the associated code.
There are other visualization modules just as interesting, but in order not to extend this article, here are the official links :
PyESASky : https://www.cosmos.esa.int/web/esdc/pyesasky
PyWWT : https://pywwt.readthedocs.io/en/stable/installation.html
Visual Profile – View your images
After retrieving the coordinates of our target, we can display an image taken during a previous astrophotography session, still with the Astropy9 library, but also Matplotlib10, 11.
This block of metadata, the header, as well as the second block containing the matrix of the image itself will allow us to visualise the image by varying several parameters if necessary.
Celestial positioning – Astrometry on the acquired image
When processing the image with the Siril software 12, an astrometric resolution was made and the result was added to the header of the fit image. It is possible to project these coordinates on our display ((ax = plt.subplot(projection=wcs_for_plot)) with Matplotlib after instantiation of a WCS object of the module of the same name from Astropy 13. It is also possible to draw the contours of the objects, according to the different levels detected in the matrix.
Sometimes it can happen that our image does not contain the astrometry information in its header. In this case, the use of the online service astrometry.net can be useful. Both methods are described below.
Spectroscopy
After visiting the Astropy library to display information from our images, we can use it, via its SpecUtils module, to display spectra made with an Alpy600.
Note that the reduction part of the 2D to 1D spectrum is not mentioned here. It is considered that this processing is carried out with standard software. (i.e. ISIS1, Demetra2, VSpec3, SpcAudace14, etc.).
It is of course possible to display our reduced spectrum using only the Matplotlib library, by exposing the values on a classical graph, you will find an example here on the Matplotlib documentation : https://matplotlib.org/3.1.0/gallery/lines_bars_and_markers/spectrum_demo.html.
SpecUtils
However, for the past 4 years, there has been a library specially dedicated to spectroscopy in Astropy. This library is called SpecUtils15, here is its general description as posted on the documentation :
specutils is a Python package for representing, loading, manipulating, and analyzing astronomical spectroscopic data. The generic data containers and accompanying modules provide a toolbox that the astronomical community can use to build more domain-specific packages. For more details about the underlying principles, see APE13, the guiding document for spectroscopic development in the Astropy Project.
source : https://specutils.readthedocs.io/en/stable/
Thus, a number of manipulation and analysis tools are already included in the package, avoiding the need to code all these parts ourselves. The example below starts from a classical spectrum of our target to display the spectrum and make a quick analysis of the Halpha line.
After this visualization, the tools present in the library make it possible to manipulate the spectrum and to analyze it.
Comparison of spectra
When several spectra are acquired over time on the same target, it is interesting to visualise them on the same graph to be able to compare them. Portions of previous codes can thus be reused. For the example below, I doubled the two files of spectra of gam Cas done the same evening to make it more visible.
Additional libraries
There are many other widely used libraries that are complementary to this introduction. For example, there are sets of modules to visualise or add interactivity to the data displayed in DataScience graphs. These libraries, such as Plotly, Bokeh, Seaborn are also associated with other modules for handling large datasets with Pandas for example.
I have already mentioned one of these libraries, namely Bokeh (via this article) to generate interactive spectra that can be inserted in a web page, as the example below, as well as an online spectrum generator from the latter, at this address: https://specbok.stellartrip.net/
To find out more about its use, you can find the code on my Gitlab space here : https://gitlab.com/chronosastro/aspyt , as well as official documentation by here.
What next ?
The Python language, like all programming languages, offers us almost unlimited possibilities on the exploitation of our data and there are many libraries and uses still to be explored. This introduction thus lays a basis which will probably be expanded in future articles to develop the astronomer’s “toolbox” with equally interesting modules such as astroquery for consulting catalogues in order to retrieve data sets, but also reproject, aplpy, (…).
Thank you for taking the time to read so far ! 🙂
Resources
The Jupyter Notebook which contains all the codes used in this article is available at the following address :
Books, Links, Videos on learning Python (mostly in French sorry)
For those in a hurry with programming notions
- Débuter avec Python au lycée : Starts Python from 0, allowing a quick start.
Python en 10 minutes : A quick introduction to language to integrate the peculiarities of language. - Python.doctor : A site that provides a reminder of common elements of language by category.
Pour les plus patients ayant peu de notion de programmation
- Apprendre à programmer avec Python3 : Gérard Swinnen’s very well known book, particularly complete in PDF version under Creative Commons licence. Different versions (i.e. epub, odt, pdf..) are also available here :https://inforef.be/swi/python.htm.
- Apprendre à programmer avec Python3 : The same book in paperback format.
- Apprenez à programmer en Python : A complete tutorial to learn how to program step by step.
- Apprendre le Python (en vidéo) : A series of videos / tutorials for learning Python in 10 episodes
- https://docs.python.org/fr/3/tutorial/ : The official online Python documentation
Sources and further information
Sources
1 http://www.astrosurf.com/buil/isis-software.html
2 https://www.shelyak.com/logiciel-demetra/
3 http://astrosurf.com/vdesnoux/
4 https://jupyter.org/
5 https://fr.wikipedia.org/wiki/Markdown
6 https://en.wikipedia.org/wiki/Astropy
7 https://www.astropy.org/
8 http://simbad.u-strasbg.fr/simbad/
9 https://learn.astropy.org/FITS-images.html
10 https://matplotlib.org/
11 https://learn.astropy.org/rst-tutorials/FITS-tables.html?highlight=filtertutorials
12 https://www.siril.org/
13 https://docs.astropy.org/en/stable/visualization/wcsaxes/ticks_labels_grid.html
14 http://spcaudace.free.fr/
15 https://specutils.readthedocs.io/en/stable/index.html
15 Image d’entête : Fotis Fotopoulos – Unplash