In order to follow the evolution of the spectra of any object, it is sometimes interesting to visualize a time series in three dimensions. This article presents an example of this type of visualization with Python..
For this example, I used three well-known and powerful modules :
Astropy and Specutils , which I have already presented here : Python for astronomy and spectroscopy : Rapid spectrum analysis , and which are used here for reading FITS files and preparing the spectrum.
Plotly which is used here to have a dynamic 3 dimensional visualization.
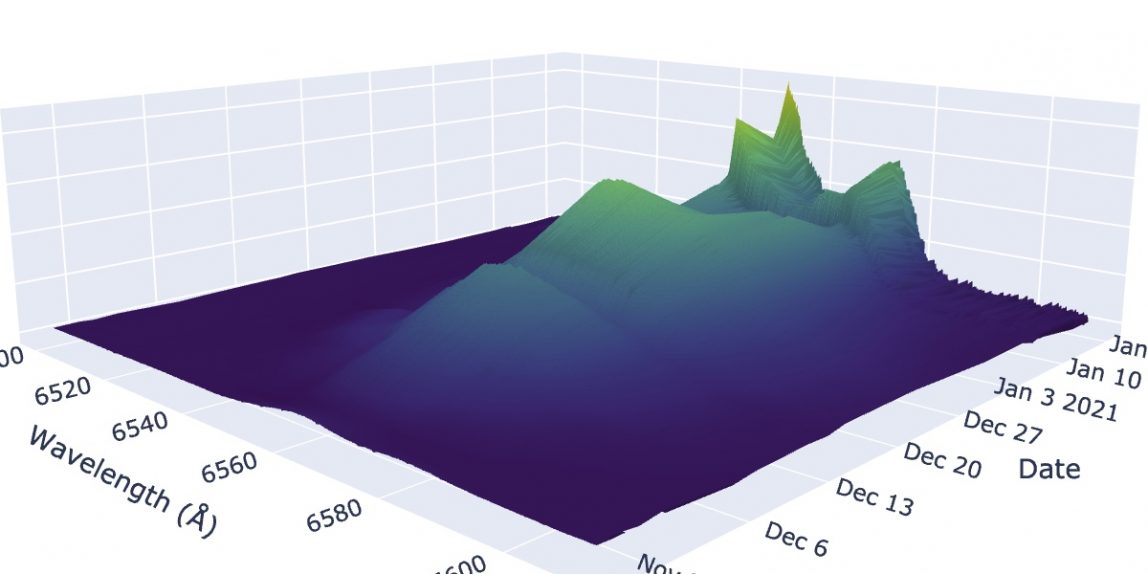
The spectra used here were performed by E. Bertrand, that I thank in passing for allowing me to use its data for illustration purposes. The object concerned is NovaPer2020 and the spectra were acquired with a Lhires III.
Here is the code and the generated output, you can see the wavelength on the X axis, the date of observation recovered in the header of each FITS on the Y axis and the flux on the Z axis.
The Plotly library allows to have an interactivity with the spectrum which is very appreciable on this kind of visualization, you can thus remain click on the graph to turn the camera with your mouse.
To go further, here are some links :
Source code and data on my Gitlab
https://gitlab.com/chronosastro/aspyt/-/blob/master/notebooks/3d_spec_timeseries.ipynb
To execute and see the result of this code online via Binder
Plotly documentation
Sources and references
1 Astropy
2 Specutils
3 Plotly
4 Astronomia Spectro – E. Bertrand