SpecBok is a Python script using the Bokeh library in order to generate Interactive Web Spectra from FITS files.
Recently, I’ve set up a web version for an easier and quicker use. The tool is available at this address : https://specbok.stellartrip.net
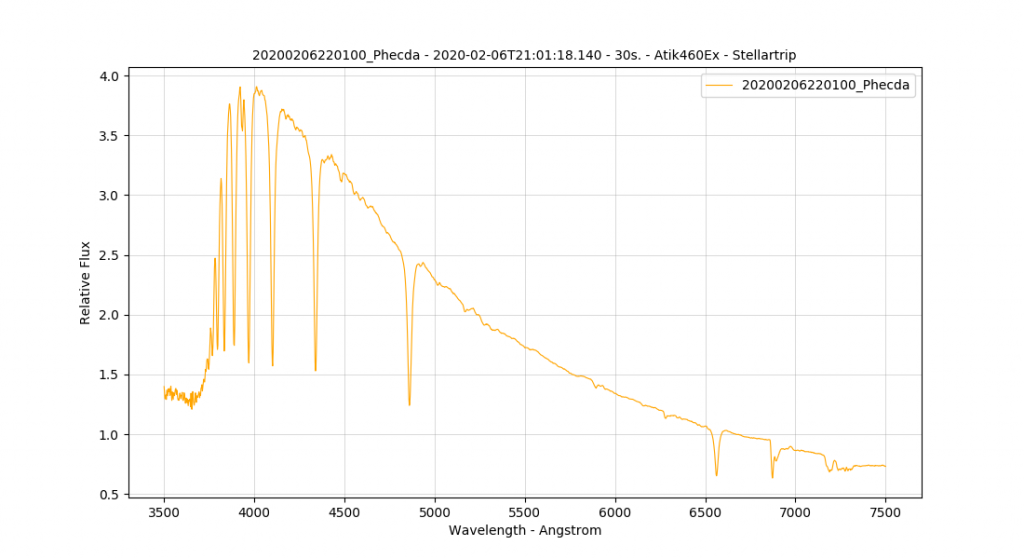
The interactive spectrum is generated within an HTML/JS page and can therefore be integrated into articles or web pages. You can find these in the spectroscopy articles on Stellartrip. Here is an example with the spectrum of the star Phecda created from this SpecBok script.
When using the initial python script available on Gitlab, it is also possible, by entering only the path of the image in the parameters, to generate a dynamic graph with the librairie MatplotLib like the one in the image below :
Online version
https://specbok.stellartrip.net
You will find all the explanations and source code of this script and the web application on the GitLab


