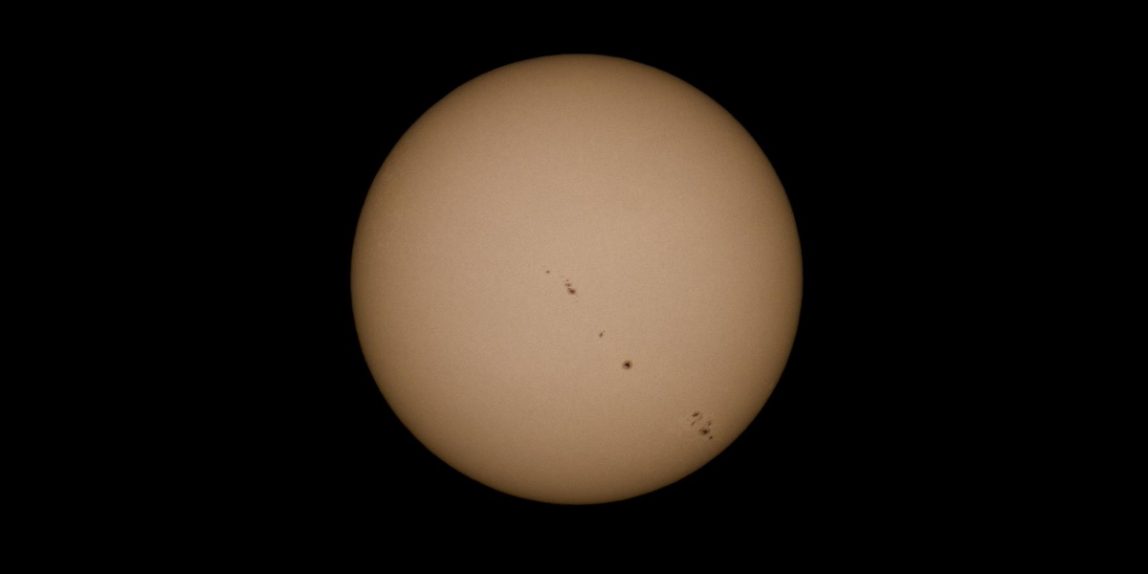
The sun sets the pace for our days and moods, yet we tend to forget that a star filled with secrets where chaos reigns is just around the corner!
Our luminous neighbor is therefore a godsend for any astronomer, because if there is a delicate parameter to manage in astronomy it is the weather. Having a clear and good quality sky at night is far from being a given. Thus, one of the advantages of having a star near your home is to be able to capture its light during the day at any time. Indeed, the latter crosses the clouds if the weather is bad. After having tried an introduction with the analyse spectrale de Véga at very low resolution, let’s push the cursors a little with the Sun !
The problem of the capricious weather being solved, there remains another step and not the least, to analyze more finely the light which reaches us. But then, how to analyze this light ?
Spectroscopy
Rather than trying to explain to you what spectroscopy is with my own words and try to give you an umpteenth explanation that might be incomplete, I might as well put forward the work of people who have already done it, and done it very well ! 1, 2
Also, to quickly understand what spectroscopy is, I can only advise you this recent video particularly well done from the series “Chercheuses d’étoiles” par Le Monde.
In order to obtain the “bar code” of our neighboring star, I used a spectroscope that decomposes the light that passes through our atmosphere. The model of the spectroscope is an Alpy 600 from the company Shelyak5 mounted on a monochrome Atik camera to be able to record the spectrum obtained.
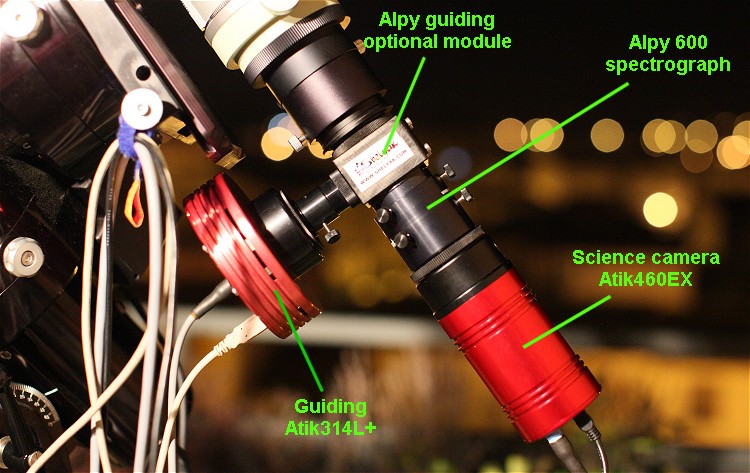
For the spectrum realized below, the spectroscope was used alone, without being installed on a telescope or a telescope.
Here is the raw image recorded by the camera, in other words the 2D spectrum of the Sun. The spectrum spreads from the left in the blue to the right in the red.
The capture is done with a monochrome CCD camera. However, from this raw image we can generate the same spectrum in color.
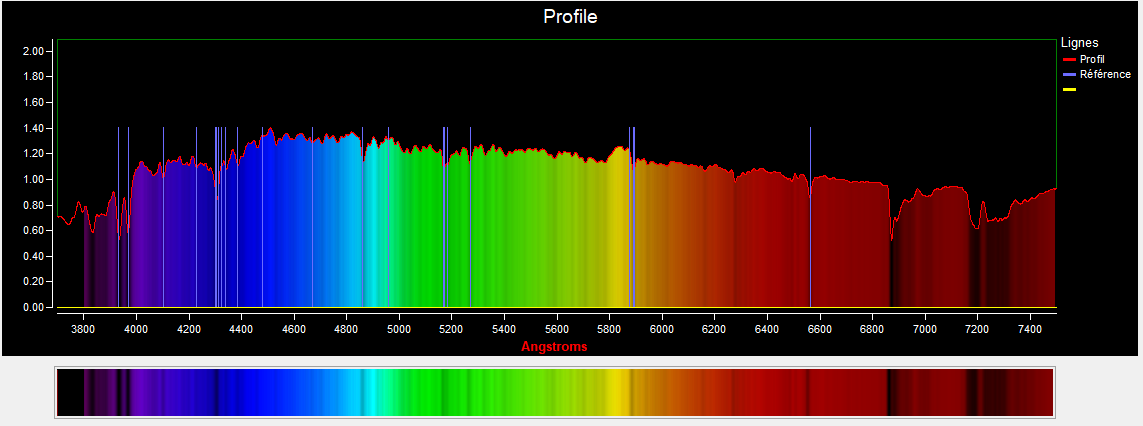
Once the image is processed with the Demetra, I obtain the spectral profile of the Sun below, namely its 1D spectrum.

Several absorption lines are clearly identified. Among these, some are characteristic of the spectral type of our neighboring star, namely a G2V type star. We will come back to what is called the spectral type of a star in a future article. In the meantime, here is a quick complement to the previous video.
Spectral Typel
(small technical interlude)
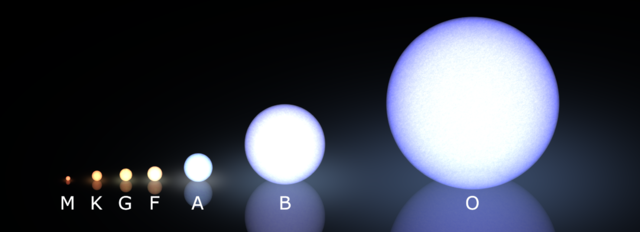
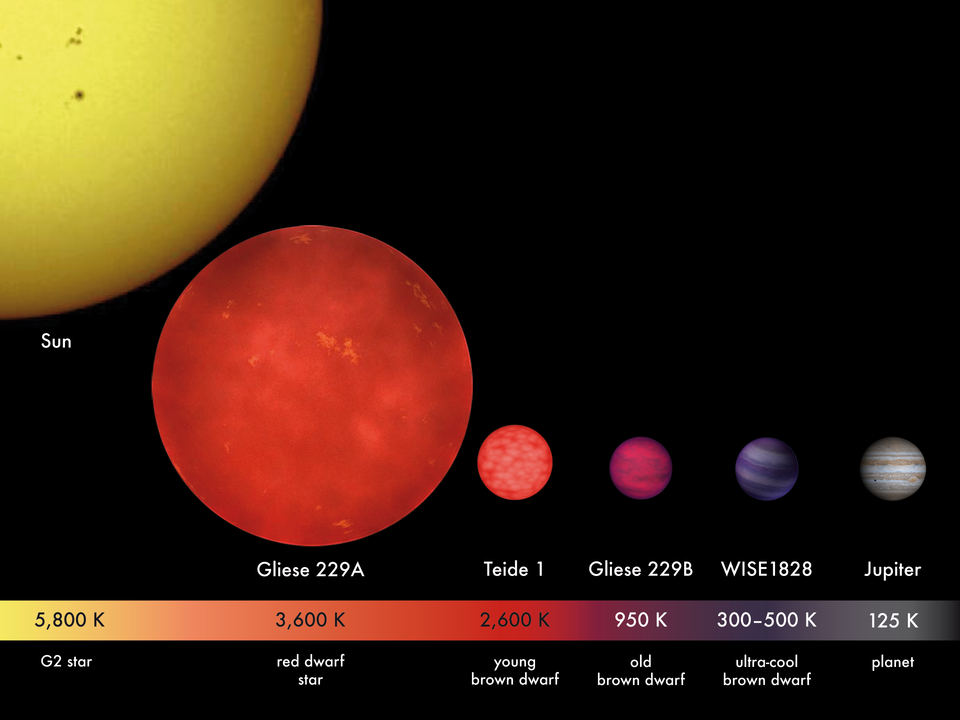
In astronomy, stars have four main characteristics: color temperature, surface gravity, mass and luminosity. These characteristics are not independent of each other and are not directly measurable. However, they allow to associate a spectral type to each star […]
The stars of type G (or yellow dwarf) are the best known, because the Sun belongs to this type. They have hydrogen lines even weaker than those of type F and lines of ionized or neutral metals. The lines of Ca II H and K are very pronounced. The G type (…) is one of the last ones where we can distinguish still quite strong molecular lines (CH, CN, C2, OH).
They owe their name “G” to the CH molecule which presents a strong absorption around 430 nm identified by Fraunhofer by the letter G. 6
The image below shows the spectrum of the Sun that I acquired, indicating the characteristic lines of G-type stars.
Chemical analysis
Let us now detail the elements that make up our close neighbor.
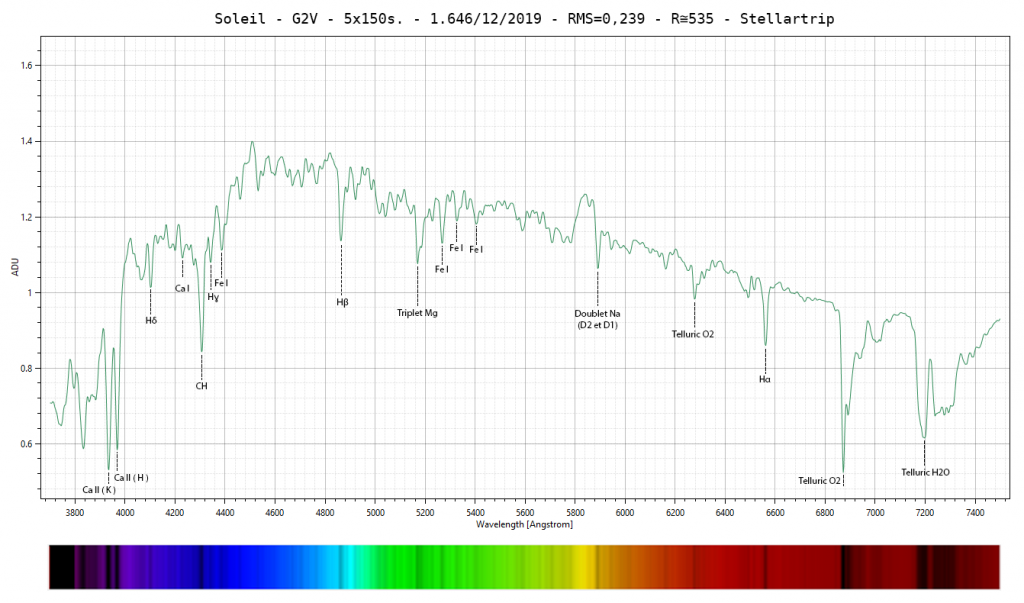
| Éléments chimiques | Longueurs d’onde (Å) |
| Ca II (K) | 3933,66 |
| CA II (H) | 3968,47 |
| Hδ | 4101,74 |
| CA I | 4226,73 |
| CH | 4299 – 4313 |
| Hɣ | 4340,47 |
| Fe I | 4383,55 |
| Hβ | 4861,33 |
| Triplet Mg | 5167,2 / 5172,68 / 5183,36 |
| Fe I | 5270 |
| Fe I | 5328 |
| Fe I | 5405 |
| Doublet Na (D2 et D1) | 5889 / 5896 |
| Telluric O2 | Lines specific to our atmosphere |
| Hα | 6562,82 |
| Telluric O2 | Lines specific to our atmosphere |
| Telluric H2O | Lines specific to our atmosphere |
We note here interesting elements that constitute the atmosphere of the Sun, namely several of the Fraunhofer lines12 as :
- The doublet of the H and K lines of Calcium ionized at 3933 and 3968 Å. Associated with these very pronounced lines of Calcium, we also find the CH molecule with a strong absorption characteristic of G-type stars.
- In addition, we note the presence of the Magnesium triplet between 5167 and 5183 Å and the Sodium doublet (D2 and D1) at 5889 and 5896 Å. Here, the resolution of the spectroscope is too small and does not allow to visualize the separation of the Mg triplet and the Na doublet.
- We also observe very clearly the spectral lines of the Balmer series for the hydrogen atom (Hꭤ to Hδ). This thus informs us about the presence of one of the main constituent elements of the Sun, namely hydrogen. To remind you, the Balmer lines correspond to the transitions of quantum states to the level state n = 2 for the hydrogen atom. The latter are observable here, because they are emitted in the visible.
“An electron tends to occupy te level closest to the nucleus. When the electron goes from a level n to a level m closer to the nucleus, the energy difference ΔE between the two levels is emitted as a light wave, of length equal to : λ = hc/Δ” 3
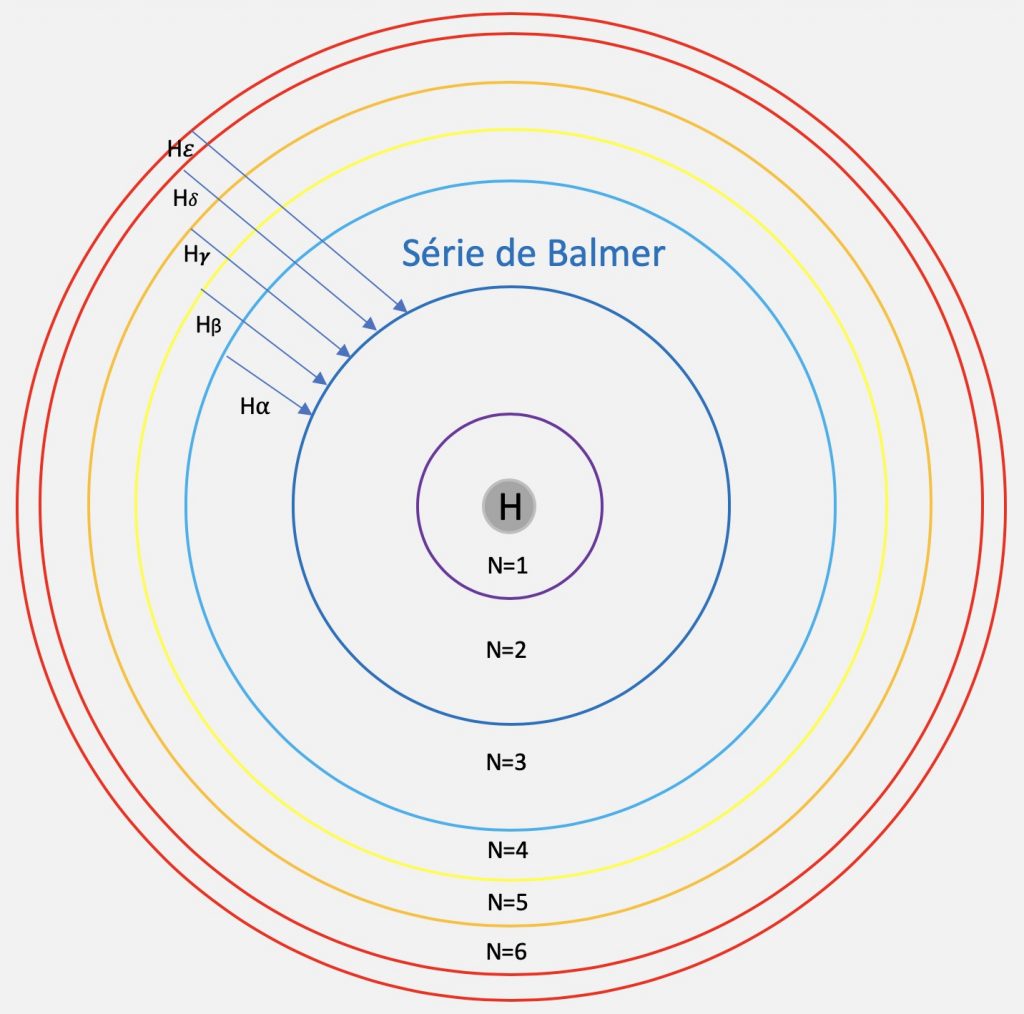
This said, we are talking about an emission of a light wave due to the release of energy, we would have a line in emission on the spectrum. But in our case, on the Sun, it is the opposite that happens. Indeed, the stars are considered as spheres of gas very hot and compressed. This source of light is however surrounded by a gaseous atmosphere colder and less dense. The atoms of the surrounding gas will be excited by this continuous radiation and change level by capturing the necessary energy and we see absorption lines appear on the spectrum.3
Temperature calculation
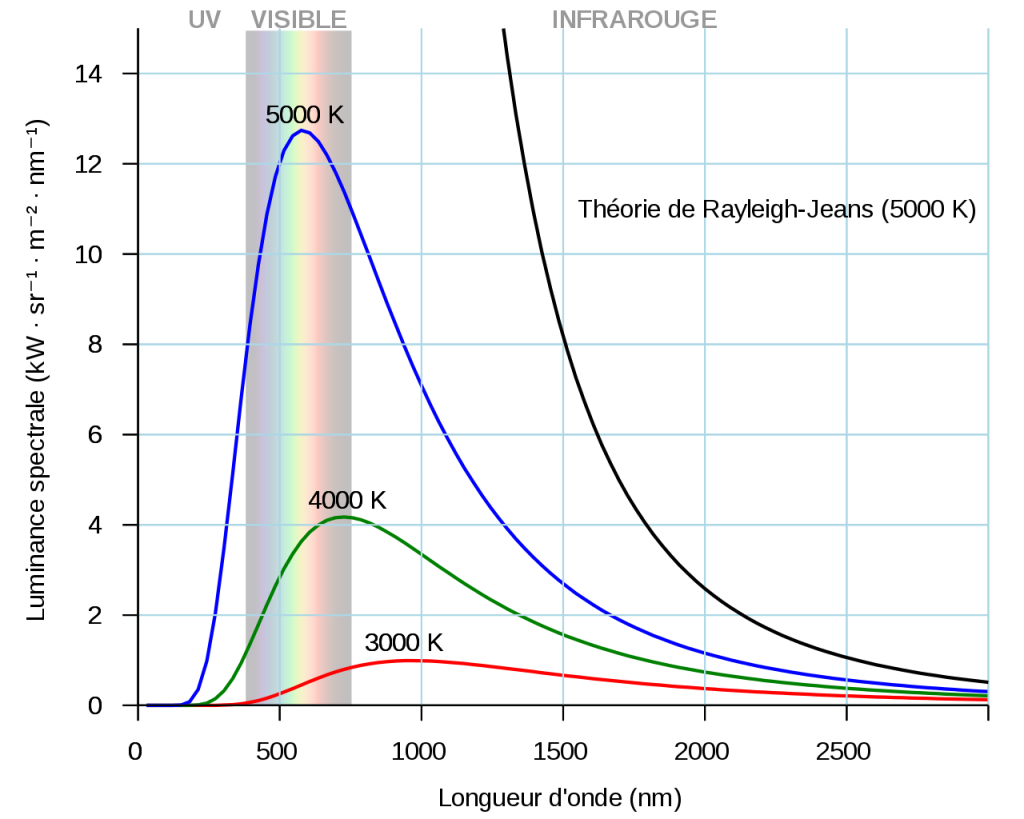
Thanks to this profile, it is also possible to determine the temperature of the object studied here which behaves like a black body.
“In physics, a black body is an ideal object that perfectly absorbs all the electromagnetic energy (all the light whatever its wavelength) that it receives
Planck’s law describes the spectrum of this radiation, which depends only on the temperature of the object. The law of Wien’s displacement determines the frequency of the maximum spectral luminance, and the law of Stefan-Boltzmann gives the flux density of emitted energy, which also depends only on the temperature of the object.” 9
You can also visualize dynamically the behavior of black bodies as a function of temperature with the Université of Colorado application below.
It is therefore from Planck’s law and Wien’s law that we can try to determine the temperature of the Sun from the previous spectrum. For this I used the software Visual Spec by Valérie Desnoux10, because the latter contains an automatic Planck profile calculation function that gives us the temperature.
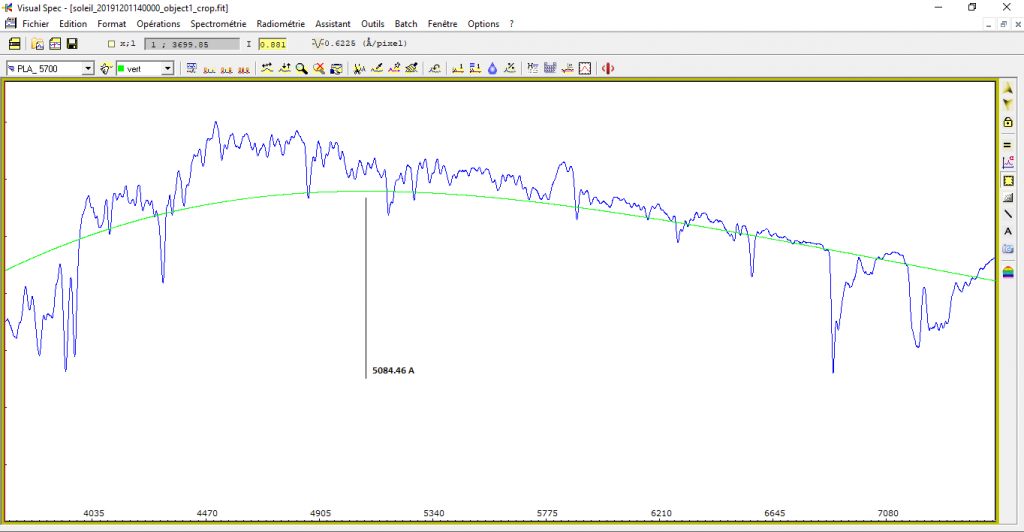
Also, even if the software gives us the temperature, this Planck profile allows us to easily calculate it. Indeed, we now have the maximum wavelength (5084.46 Å). It only remains to apply Wien’s law to find the temperature :
Wien’s law
“The wavelength λmax which, in the spectrum of a black body, corresponds to the maximum energy, varies inversely with the temperature T (in degrees Kelvin)” 3
λmax . T = 2898 ( µm . K ) = constant
The maximum wavelength here is 5084.46 Å.
T = 2,898.10-3 / λmax
T = 2,898.10-3 / 5,08446.10-7
T ≅ 5700 K
Units
λmax in m
T in Kelvin
A rather interesting result compared to what we find in the literature, because the temperature of the surface of the Sun is indicated at about 5750 K3,7,8. The value found here corresponds well to the Planck profile of our star, whose maximum emission is in the visible.
Conclusion
To conclude, with this quick and modest analysis, we have been able to rediscover some physical and chemical aspects of our daily companion by walking in the footsteps of the pioneers of the past. Probing the mysteries of our star in its present state is exciting, and I look forward to exploring other stars to share it with you in the near future…
Acquisition protocol
| Date and time of acquisition | 01 décembre 2019 14H00 |
| Acquisition camera | Atik 460Ex à -5°C Binning 1×1 |
| Spectroscope | Alpy 600 Slit 23µm |
| Images et calibration | 150s lights 5 images of calibration ArNe 15 seconds 5 Flats 3 seconds 5 Darks of 150 seconds 5 Offsets |
Sources and additional information
Sources
1 If you want to go further, I also recommend this particularly interesting video-conference on the subject by Patrick Boissé, astrophysicist at the IAP: Video-Conférence – La Spectroscopie : un formidable outil pour comprendre l’univers
2 Chercheuses d’étoiles – lemonde.fr
3 Acker, A. (2017). Astronomie Astrophysique, 5e édition. Dunod – ISBN-13 : 978-2100576401
4 Walker, R. (2017). Spectral Atlas for Amateur Astronomers: A Guide to the Spectra of Astronomical Objects and Terrestrial Light Sources. Cambridge: Cambridge University Press. doi:10.1017/9781316694206 – ISBN13 9781107165908
5 Shelyak.com
6 Wikipedia : Type Spectral
7 Service d’observation du Soleil – LESIA – Observatoire de Paris
8 Wikipedia : Soleil
9 Wikipedia : Corps noir
10 Visual Spec – Valérie Desnoux
11 Wikipedia : Série de Balmer
12 Wikipedia : Raies de Fraunhofer
